
Last year was our warmest on record, but it’s the speed of change that should most concern us [3 February 2015 | Peter Boyer]
The verdict on global warming in 2014 is in. The Japanese, US and UK public institutions that keep a continuous watch on global surface temperatures have now reported on last year’s place in the thermometer record.
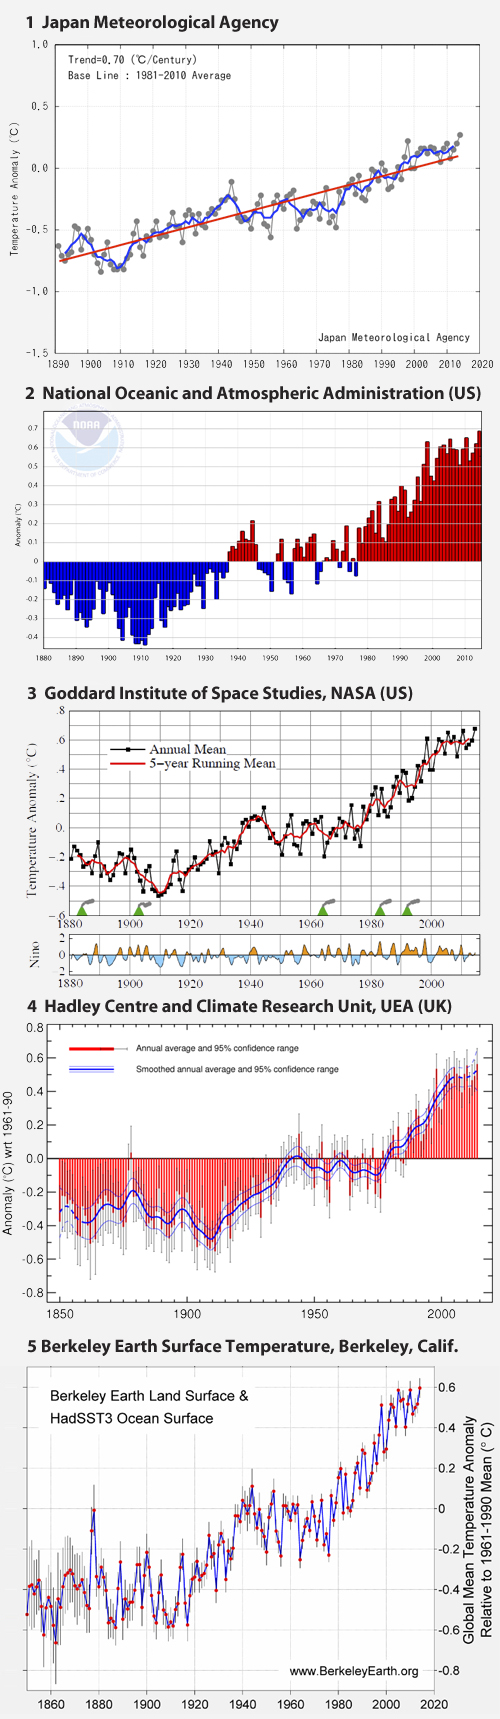 The Japan Meteorological Agency was first off the mark, reporting its finding in the first week of January. From the US around the middle of the month came the reports of the National Oceanic and Atmospheric Administration (NOAA) and NASA’s Goddard Institute for Space Studies.
The round was completed last week with the joint release of December 2014 data by the UK government’s Hadley Centre and the University of East Anglia’s Climate Research Unit.
For good measure, the University of California’s “Berkeley Earth” project, a privately-funded research group set up in 2010 to review official findings, has also come to a conclusion.
The five institutions independently determined the 2014 mean temperature drawing on surface readings from around the globe, each using their own methodologies developed and fine-tuned over the years. Two use records dating back to 1850 while the other three start at 1880.
The verdict was all but unanimous. Four concluded that on average, Earth’s surface in 2014 was the warmest on record, while the UK-based analysis found that 2014 shared the record with 2010.
Unusually – unlike the three next-warmest years (2010, 2005 and 1998) – last year’s record was reached in the absence of an El Nino event, when warming Pacific waters raise global temperatures.
Most assessments had a very small gap between 2014 and the next warmest, although NOAA’s National Climate Data Center found the average temperature in 2014 “easily” surpassed the 2010 figure, by 0.04C.
NOAA also noted that nine of our 10 warmest years have been since 2000. The 20th century’s warmest year, 1998, is now fourth warmest overall. All of the past 38 years and all of the past 358 months were warmer than their respective 20th century averages.
Which brings me to odds. In a totally random universe with no climate drivers in play, the chances of 2014 being the hottest year since 1880 are one in 134. But when you consider the current cluster of warm years, the odds suddenly lengthen.
Last month the Associated Press got advice from US statisticians about the chances of this warming sequence being random. They calculated that the odds that 13 of the 15 hottest years on record would all be in the most recent 15 years (as has happened) were more than 40 trillion to one.
When the statisticians looked at the random chance that 358 months in a row will all be warmer than their respective 20th century averages, the odds shot out to an unnameable number ending in over 100 zeros. There’s nothing random about today’s warming world.
It’s the trend that counts. NOAA found that while the average rate of warming since 1880 has been 0.06C a decade, since 1970 the warming trend per decade is nearly three times that, at 0.16C. At this rate, by 2100 warming will be way beyond the agreed danger threshold of 2C.
I’ve dwelt on all this at some length because the global temperature record has been the subject of long and quite heated internet debate over recent weeks, including on the Mercury website.
Let’s put this in perspective. The surface temperature record goes back to the second half of the 19th century. Indirect analysis from satellite data started only in 1979. By themselves, neither say anything about long-term climate.
Proxy records like tree rings and ancient ice, corals and sedimentary rocks can tell us about climate thousands or millions of years ago. These records show that carbon dioxide was last at today’s levels about three million years ago, over 2.8 million years before humans walked the Earth.
The last time they were at the level that we’re heading for by the end of this century was well over 30 million years ago when crocodiles lived in Arctic lands, US geologist Howie Scher told a Hobart audience last week.
Sher, a visiting scholar at the University of Tasmania’s Institute of Marine and Antarctic Studies, pointed out that during the ice melt at the end of the most recent ice age, each year on average Earth’s surface warmed by 0.001C and carbon dioxide levels rose by about 0.006 parts per million.
But compared to that event 20,000 years ago, warming over the 134-year thermometer record has been five times faster (over 15 times faster in the past two decades), and over the 56-year carbon dioxide record our CO2 levels have risen 250 times faster (currently over 300 times faster).
In fact, says Sher, these crucial elements of the climate system are changing as much as 100 times more quickly today than at any time in Earth’s geological record. Is this alarming? I think so.