The most disturbing message out of a new temperature study going back 11.3 millennia is the speed and scale of modern warming compared with warming earlier in the Holocene.

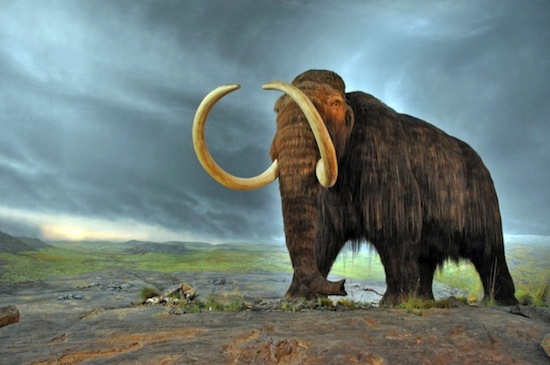
Woolly mammoth. Royal British Columbia Museum, Victoria BC, Canada
Ten thousand years ago, the last of the woolly mammoths were taking their final faltering steps toward extinction.
Human hunters and climate change were the fatal blows for these great elephant-like creatures, which had survived and thrived across northern Asia, Europe and North America for millions of years.
It’s possible that their disappearance, in turn, influenced climate. A 2010 scientific study suggested that diminishing mammoth numbers allowed energy-absorbing trees to form huge forests across northern steppes, raising global temperatures by as much as 0.2C.
As Earth slowly emerged from the last ice age, humans lived by hunting and foraging. They were still thousands of years away from discovering agriculture and forming settlements. Civilisation was yet to be invented.
It’s these far-distant times that Oregon-based geoscientist Shaun Marcott and three US-based co-authors chose as the starting point of their study of Earth’s changing temperature, published this month by the American Association for the Advancement of Science in its journal Science.
Another temperature study wasn’t high on my list of things to write about this week, but in the context of our global failure to attend to the challenge of rising carbon emissions, this paper demands attention.

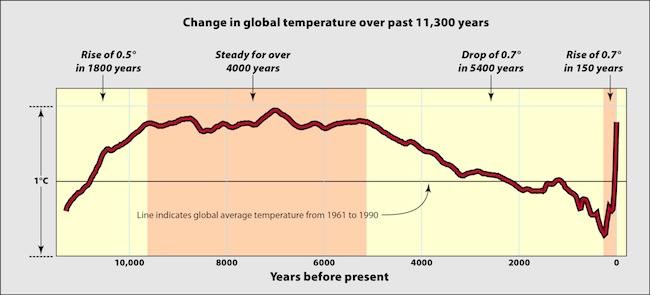
New plot of Holocene global temperature showing the modern warming shift. SOURCE: Marcott et al (2013). A Reconstruction of Regional and Global Temperature for the Past 11,300 Years. Science, 8 March 2013: Vol. 339 no. 6124 pp. 1198-1201)
The graph produced by Marcott’s team, tracing the movement of global temperature over the past 11,300 years, may in time even join the famed “hockey stick” graph as an icon of global warming.
Which suggests that Marcott and his co-authors should prepare to defend their reputations.
They’ll be well aware of the experience of Michael Mann, the physicist who drew on an unprecedented array of historical records, biological data from corals, pollen and tree rings, and cores from polar ice sheets to determine temperature in times before thermometer records.
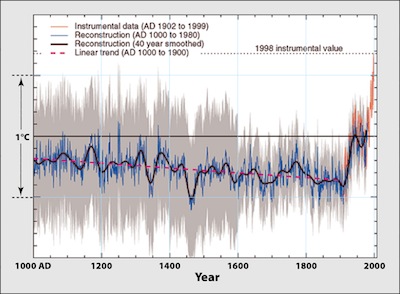
Mann and his co-authors, climatologist Raymond Bradley and tree-ring specialist Malcolm Hughes, published papers in 1998 and 1999 indicating that in the late 20th century a rapidly-heating Earth was at its warmest for at least 1000 years.

Michael Mann’s “hockey stick” temperature plot as reproduced in the IPCC Third Assessment Report of 2001
The “hockey stick” graph, with its characteristic upward tick at the end marking a new abrupt warming trend in the modern era, was incorporated into the 2001 Intergovernmental Panel on Climate Change report. That attracted the attention of conservative US politicians and lobbyists, who attacked Mann drawing on suggestions in scientific circles that his methodology was flawed.
Mann’s email correspondence with Phil Jones, head of the Climatic Research Unit at the University of East Anglia, became the centre of the so-called “Climategate” controversy after the university’s website was hacked into in late 2009 and the emails published anonymously.
A 2006 academic inquiry found Mann’s methodology to be sound. Since 2009 his and Jones’s scientific reputations have been cleared by UK and Netherlands judicial inquiries, and Virginia Attorney-General Ken Cuccinelli has lost two court battles against Mann over his research funding.
Now contrarians have a new target — a graph that I find more shocking than Mann’s.
The Marcott paper describes findings from analysing proxy records dating back to a time when Earth was still warming after the last ice age. It finds that this warming stopped about 9550 years ago, after which for about 4000 years temperatures hovered around a level similar to that of today.
The signals from the proxy records are that Earth began to cool again about 3500 BC. The cooling happened extremely slowly, with the mean temperature dropping by 0.7°C over 5400 years, or just 0.01°C per century — time enough for life forms to adapt to changing conditions. As it should be.
This followed the pattern of previous “interglacials” — the periods in between ice ages — when relatively rapid warming was followed by a plateau, then a steady temperature decline over many millennia and the eventual onset of a new ice age.
In keeping with the findings of Mann and numerous other studies, Marcott’s team found an abrupt shift from the late-19th century. The rate of warming when the mammoths died out was less than 0.03°C per 100 years. In the last 150 years it’s been more than 16 times faster, at 0.5°C per century.
But that’s just the average. Since about 1975 the rate of warming has increased still further. As Climate Commissioner Will Steffen said early this month, this is a climate on steroids.
In the wake of the fuss over Mann’s “hockey stick”, I don’t hold out much hope that the Marcott paper’s message will have enough impact on policymakers to make a difference. New data show our global carbon emissions headed in the same direction as the temperature — up.
At the end of February levels of carbon dioxide at Mauna Loa, Hawaii, were at an all-time high of 396.8 parts per million, a jump of 3.26 parts per million over the preceding 12 months, and are expected to top 400 ppm this year.
The global mean at the end of 2012 — 395 ppm — was 2.67 ppm up on the figure a year earlier. At this rate the global figure will pass the disturbing milestone of 400 ppm of atmospheric carbon dioxide within a year or so. That’s about 43 per cent higher than at any time over the past 800,000 years — all of it our very own work. What an achievement for mankind!
By 2020, a Dutch government report says, emission levels of the world’s rich countries will have to be half what they were in 1990 for there to be even a medium chance of keeping human-induced warming to no more than 2C above the natural background level.
Australia’s bipartisan target is a 5 per cent cut by 2020 — too little by a factor of 10. We have some work to do.
