A Hobart scientist’s achievement in casting light on what is causing our sea levels to change has been recognised with Fellowship of the Australian Academy of Science. [10 April 2012 | Peter Boyer]

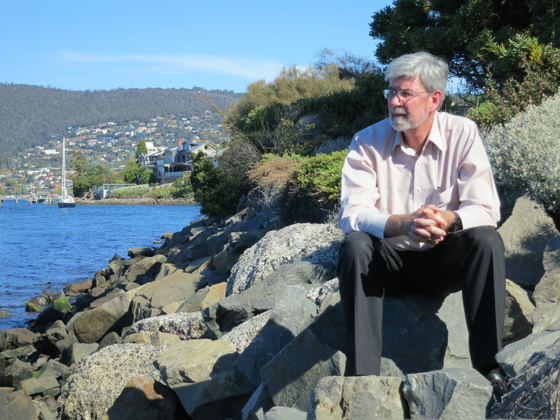
Near Hobart's CSIRO Marine and Atmospheric Research Division, John Church looks over the waters of the Derwent Estuary, which according to current estimates are rising at around the global average, about 3.1 mm a year.
Under low clouds, perhaps lit by a lightning bolt, the city waits helplessly as a wind-whipped surge of ocean water approaches, threatening to inundate all in its path. That’s the sort of image that’s come to represent the future shock of human-induced climate change.
Humans’ age-old fear of inundation from the sea is real, and sea levels are indeed rising. But we can do without the histrionics. To deal with this predicament, what we really need is the dispassionate, evidence-based light of science.
Who better to provide that than Hobart-based CSIRO oceanographer Dr John Church? Last week Church was notified that he had been awarded Australia’s highest scientific accolade — election to the hallowed ranks of Fellow of the Australian Academy of Science.
To me, there’s something about Church that’s both frustrating and reassuring. As a news reporter I was brought up on the “good story”, which preferably contained something unique, unprecedented, horrifying or superlative — something to hang a good yarn on.
John Church doesn’t do that sort of thing, which can be frustrating.
But what he does do is something I’ve come to value much more. His cautious, qualified, measured statements about the behaviour of our oceans makes it immediately obvious that this is a person to be taken seriously.
We have a lot invested in our coastal lands, so the last thing we need is spin about rising sea levels based on someone’s unquestioned claims. Seduced by the apparent simplicity of sea level science, amateur observers have come out with counter-claims that the so-called rises are a figment of scientific alarmism while others have argued disaster is imminent.
What we need is to know what’s actually happening, to be confident that the person giving us the low-down is a person of integrity, with nothing to gain or lose whichever way the evidence takes us. This is why I find Church so reassuring.
Some sea-level scientists using macro-level statistical models are currently suggesting we might be in for a rise in global average sea level of as much as 1.8 metres by 2100. That would be a shock to most people, but Church counsels caution with such estimates.
As lead sea level author for the 2013 report by the Intergovernmental Panel on Climate Change, Church carries a heavy responsibility to get things as right as they possibly can be. There are high standards to maintain — the 2007 IPCC analysis of the physical science has withstood intense global scrutiny that so far has found no significant issues.
That report found that even without the uncertain influence of melting polar ice sheets, sea levels will rise this century on average by 0.18 m to 0.59 metres. Factoring in an estimate of contributions from ice sheets, the 2007 IPCC projections would have our seas about 0.8 metres higher on average by 2100.
Although the evidence confirms that sea level is rising and will continue to rise through this century, Church doesn’t dwell much on any particular figure. His approach is to get to understand the many different influences on sea level and then to try as far as humanly possible to quantify the contribution of each to the overall picture.
In a nutshell, after 20 years of intensive study of the oceans and sea level, here’s what Church has to tell us:
• Sea level is not a global constant, a single figure applying everywhere. It varies from place to place, largely but not solely as a result of varying pressure gradients. Sea level is highest in subtropical ocean gyres, around 20 deg north and south of the equator.
• Sea level has been rising since the 19th century. Satellite altimeter data tells us that sea level is currently rising by about 3.1 mm a year, near the upper limit of post-1990 IPCC projections and significantly above the 20th century average rate of about 1.7 mm a year.
• The biggest current contributors to sea level rise are mountain glaciers and a warming ocean (warmer water takes up more volume), with other contributors including aquifer depletion, dam storage (negative) and major land flooding events (negative until water flows back to the sea).
• Increasing, and potentially very large, contributors are the big polar ice sheets, but much more needs to be known about their behaviour, especially the interaction between the ice sheet edges and warming ocean waters, before we can confidently assess this. In past times they have contributed to sea levels metres above what they are today.
• A big long-term concern about the ice sheets is when they might pass a threshold after which their disintegration is inevitable (though happening over centuries). Current estimates are that 3C of global warming — possibly less — will push the Greenland ice sheet past its “tipping point”, which would ultimately cause oceans to rise by several metres.
• While some of current sea level rise may be a result of natural variability, the evidence is clear that most is due to warming resulting from human greenhouse gas emissions.
• Over many years through the 21st century, we will have an increasing rate of rise, crossing thresholds more often than ever before. The consequent impacts on coastal communities underline the need for authorities and affected property owners to start planning now — and for all of us to support all feasible measures to cut emissions.
In Tasmania we have a ringside seat to some world-leading climate science — not just John Church’s but also that of numerous other global authorities. We should aim to make the most of it.
