What sort of climate calamity will it take to stir humanity into action? [23 October 2012 | Peter Boyer]

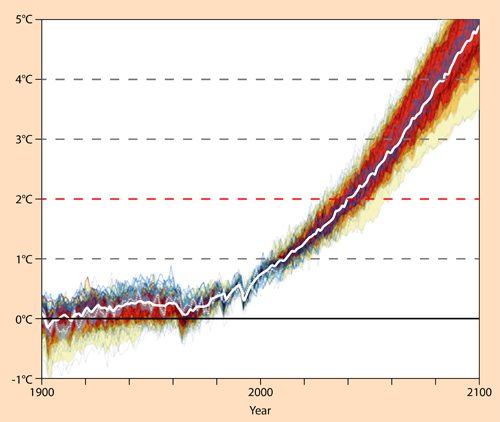
Malte Meinshausen’s disconcerting projections for the temperature impact of “business-as-usual” emissions up to 2100, showing the world crossing the 2-degree threshold by 2040 and nudging 5 degrees of warming by 2100.
There’s a lot of black humour about in climate science circles these days. Here’s a sample from a CSIRO seminar on global carbon emissions, given in Hobart this month by University of Melbourne emissions specialist Dr Malte Meinshausen.
China’s explosive economic growth has now made it the world’s leading greenhouse gas emitter, but its per-capita figure (national emissions divided by total population) has been much more modest than that of developed countries like Australia.
But the level of China’s per-capita emissions was about to overtake that of the European Union at the end of last year, when it stood at 7.2 tonnes per person. So your statistical average Chinese person now emits more carbon dioxide than your average European.
Meinshausen’s little joke was that Australians shouldn’t worry about this, because China still has a long way to go before it topples the world champions. Our own world-leading per-capita emissions in 2011 were about 19 tonnes per person.
After years on the climate hustings I’m pretty hardened to this sort of stuff, but I found Meinshausen’s presentation especially depressing.
Like Europeans and North Americans, Australia has been burning fossil fuels for 150 years or more. China’s “march of progress” is barely 20 years old. With India and Brazil hot on China’s heels, and many other developing countries seeking their slice of the action, how can emissions possibly be contained within “safe” limits?
Take a moment to consider where things are at in the world. I mean the real story, not the official one. Here are some well-documented current events:
• The Arctic is warming twice as quickly as was projected in the “worst-case” scenarios for the last major international climate science report in 2007.
• In the summer just past, the amount of Arctic Ocean sea ice was the lowest ever recorded, both in area covered and volume of ice — less than half of the summer minimum 30 years ago. The loss of ice cover is speeding up the warming of the exposed ocean.
• Both Greenland and Antarctica continue to shed land ice at an increasing rate, adding to sea level rise. In the case of Greenland, the rate of ice loss this summer was another all-time record.
• This year, US scientists produced evidence to show that extreme weather conditions across the Northern Hemisphere, including devastating droughts in the US and Russia and flooding in Europe, Pakistan and China, are caused in large part by ice loss in the Arctic.
• The global food crisis, with climate change as a major driver, is now in its fifth year, and is set to intensify as the effects of recent drought and flooding in key exporting countries are felt down the food chain.
• This month we learned that half of the corals of Australia’s magnificent Great Barrier Reef have disappeared since 1980 because of warmer, increasingly acidic, polluted seas and infestations of predatory starfish — all directly or indirectly a result of human activity.
• Under our noses, off eastern Tasmania, rapidly-warming seas have brought invasive sea urchins that have devastated kelp forests and other habitat for local species, including key commercial species.

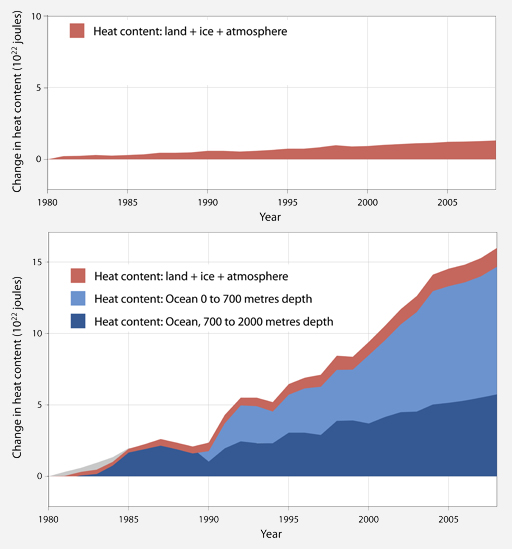
Heat content of the world’s land, ice and atmosphere (above), and with ocean heat content to 2000 metres depth added (below). (Data source: D. Nuccitelli et al., Physics Letters A (2012), http://dx.doi.org.10.1016/h.physleta.2012.10.010)
A research paper published this month in Physics Letters (two Australians including Tasmanian Dr John Church are among its five authors) contains a graph that provides a powerful visual reminder of the relevance of the global ocean to temperature. The graph shows the heat contained in the planet’s land, ice formations and atmosphere increasing by an apparently modest amount over the past 40-odd years. But when you add in the global ocean down to 2000 metres depth, the graph line steepens dramatically. This is what global warming really looks like.
Global warming is really more about oceans than anything else; over 90 per cent of the heat energy from atmospheric warming finishes up there. This new paper tells us that with warming oceans the world’s net global heat content is increasing at an accelerating rate.
Another sobering graph, in Meinshausen’s CSIRO presentation, indicates that the current global emissions trajectory will see surface warming pass 2C (agreed by world leaders in 2010 to be the danger threshold) by 2040, and pass the catastrophic level of 5C around 2100.
These two unfolding scenarios — “business-as-usual” emissions and a warming global ocean — take on an even greater potency when seen in light of the inertia of global systems. Like large ships under way, global systems need a lot of time to change course.
Think about these two connected factors:
First, it takes around 25 years before emissions from human activities today take full effect, so the atmosphere will continue warming for at least that length of time even if we stop emitting greenhouse gases this instant. That’s not happening, so the air will go on warming much longer than 25 years.
Second, the ocean will continue to store heat from the atmosphere for yet more years, preventing or inhibiting the cooling of the planet until long after we’re dead and buried. The only question is, how far will the warming go? The more carbon dioxide we put into the atmosphere, the hotter it will get.
The message from science is laden with foreboding. I confess that, right now, I fear for our future. In a world strangely distracted from the crisis unfolding around us, I’m far from convinced that we have what it takes to turn those graph lines downward.
There’s plenty we can do, but it needs to be radical, and ever more radical the longer we delay. To even begin, we must summon the will to act together, both in our own country and in concert with others around the world. Overcoming that hurdle makes the science look like child’s play.
