Maintaining that global warming has stalled since 1997 is pure delusion. [11 March 2014 | Peter Boyer]

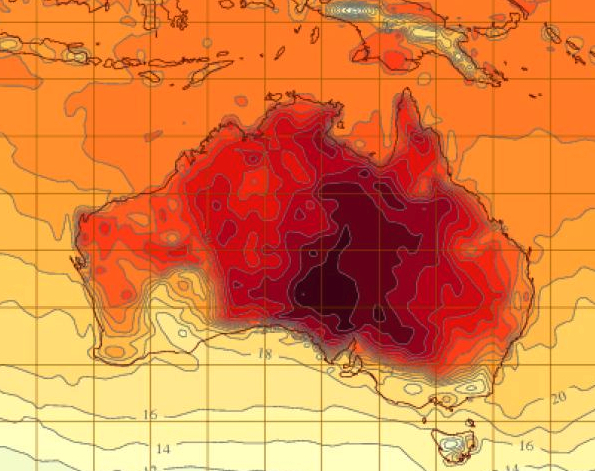
A heatwave over Australia, New Year’s Day, 2014. BUREAU OF METEOROLOGY
“Seventeen and a half years. Not a flicker of global warming.” That was Christopher Monckton’s take on satellite temperature data released last week by Remote Sensing Systems (RSS) of Santa Rosa, California.
RSS processes and analyses data from microwave sensors on orbiting satellites to track changes in the atmosphere from the surface to the edge of space. Their work complements other data sources, with a special strength in remote places not so well covered by surface weather stations.
As RSS points out, the troposphere (the lower atmosphere, closest to the surface) has warmed over the past 35 years at an average rate of about 0.13C a decade. The warming is evidenced by declining Arctic sea ice, dwindling mountain glaciers and accelerating sea level rise.
No natural phenomena can be found to explain why we’re getting warmer. The only clear warming signal is higher greenhouse gas levels caused by emissions from human activity.
At the rate of increase in today’s carbon emissions, most climate models say we should be warmer than we are. Some climate scientists have described this discrepancy with words like “hiatus” and “pause”. Contrarians like Monckton argue that it seriously undermines the case for global warming.
Exploring why warming hasn’t matched model projections, scientists are looking at more volcanic particles and stratospheric water vapour, more heat take-up by the deep ocean, lower emissions of ozone-depleting chemicals and solar variations. As always, this is a work in progress.
In the meantime, the ever-alert contrarian community has seized upon the gap between models and observations as proof positive that global warming, if it ever happened at all, has now stopped, and that this “truth” is being covered up by “warmist” scientists. I’ll come back to this.
Global annual average temperatures are a very broad brush that can mask important information about the impact of a changing climate in particular regions or seasons. We might overlook a slow warming of the planet, but extreme temperatures are something else altogether.
Heat extremes were the focus of a study, published in Nature Climate Change last week, by Swiss climatologist Sonia Seneviratne, Canadian Brigitte Mueller and two Australians, Markus Donat and Lisa Alexander of the Centre of Excellence for Climate System Science in Sydney.
The team identified the hottest 10 per cent of days for each year in regional climate records for inhabited lands around the world since global satellite data began in 1979. They then compared extremes in the earlier part of that period, from 1979 to 1996, with those for the period from 1997 onwards.
They found that since 1997 people around the world have experienced greater heat extremes more frequently, for longer periods and over greater land areas, than in the earlier period.
This has happened despite the fact that since 1998 there’s been no strong El Nino event, the peak of a natural warm-cool cycle in the Pacific. El Ninos have long been known to have a warming effect globally.
Increasingly extreme heat events were also one of the features of the biennial “State of the Climate” report by two of Australia’s peak scientific organisations, the CSIRO and the Bureau of Meteorology, which came out last week.
Heatwave analysis is limited by sparse data before 1950, but records since then show that in the past 20 years, days of extreme heat spreading across the continent have become more common, and the duration, frequency and intensity of heatwaves have increased.
State of the Climate reports that seven of Australia’s ten warmest years on record have occurred since 1998. Last year was our warmest on record, 1.2C above the average for 1961 to 1990 and 0.17C above the previous warmest year in 2005.
Hottest-ever daytime temperatures in Australia since 2001 have outnumbered coldest-ever records by almost 3 to 1. Night-time temperatures, an important signal of greenhouse warming, show an even greater discrepancy: warmest-ever minimum readings outnumber coldest-ever by 5 to 1.
Comparing the past 15 years with the period from 1951 to 1980, the report finds that the frequency of very warm months has increased five-fold and the frequency of very cool months has declined by around a third.
Which brings me back to the claim of “not a flicker of global warming” by our contrarian friend Lord Monckton, and an opposing case put by “Tamino”, pseudonym for Grant Foster, a statistician who writes a blog called Open Mind.
Major global data sets from 1979 (the first year of global satellite data) until 1997 reveal that in those years mean surface temperature trended strongly upward. To my knowledge no-one disputes that.
Analysing six global data sets, Tamino extended the 1979-1997 trend line out to 2013 to show that warming has persisted right through to the end of 2013, broadly following the warming trend for the earlier period except for an upward step of 0.2C in 1998.
That year saw a huge anomaly, when the mean global surface temperature, driven by an unusually powerful El Nino episode, went way beyond anything ever seen since instrument records started in the 19th century, and raised the spectre of runaway warming in following years.
Runaway warming hasn’t happened, but we continued to get very warm years. The baton for warmest-ever year has now passed to 2010, and the post-1998 trend remains broadly consistent with the trend before that year. That is, for all the talk of a “pause”, the world continues to get warmer.
Monckton bases his claim that warming has stopped on a single aberration in 1998. His message is what everyone wants to hear, but we’d be plain dumb to stake our future on it.
