While global surface temperature records continue to fall, warming seas raise the spectre of irreversible melting in Antarctica [28 October 2014| Peter Boyer]
Some news we could have done without: Planet Earth has just had its warmest September since global thermometer records began 134 years ago.
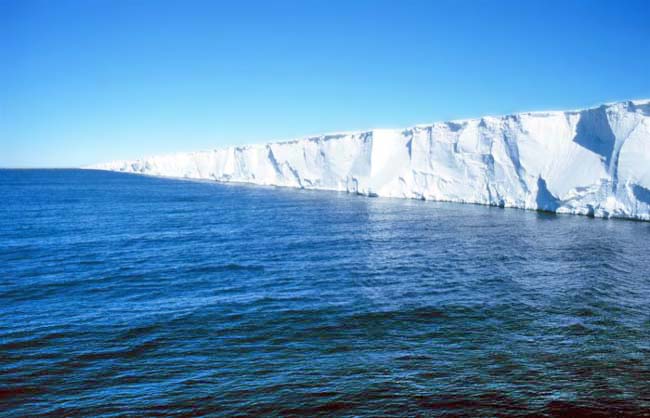
The mighty ice cliffs at the northern edge of Antarctica’s Ross Ice Shelf, largest in the world. PHOTO MICHAEL VAN WOERT, NASA
That came straight after the warmest August and, a month or two earlier, the warmest May and June. There have been quite a few such monthly records in recent years. By contrast, the last time the world had a coolest-on-record month was nearly 100 years ago, in December 1916.
The 12-month period to September was the warmest ever recorded, and 2014 is on track to be the warmest calendar year on record. Remarkably, all this has happened in the absence of an El Niño weather event, which would have caused even greater warming.
Such surface temperature information (this comes from the US National Oceanic and Atmospheric Administration) is prima facie evidence that we have long-term climate warming. An even more telling indicator of this is the great block of ice to our south.
The huge Antarctic ice sheet holds 70 per cent of the world’s fresh water and over 90 per cent of its ice, which being mostly well above sea level has the potential to cause a big rise in ocean waters around the world. If it lost even a quarter of its ice, seas would be 15 metres higher.
Taken as a whole, the ice sheet of Antarctica has been slow to respond to a warming atmosphere and ocean. Satellite instruments are revealing that increased snowfall is actually making part of the ice sheet bigger. But this is more than countered elsewhere by coastal melting caused by a warming ocean.
Antarctica as a whole is losing 300 million tonnes of ice a day, mainly around the coast of West Antarctica and the Antarctic Peninsula, south of South America. A 2013 research paper reported ice loss on the Peninsula had risen tenfold in 1000 years.
But satellites can give only a broad-brush picture. To know what’s happening in particular places we need information on the ground, which is where “Necklace” comes in.
The scientists who coined that title describe it as an “over-engineered acronym”, somehow derived from “network for the collection of knowledge on the melt of Antarctic ice shelves”. But it’s an apt name for a project that aims to encircle the continent with ice measuring stations.
The Antarctic coastline is punctuated by massive slabs of ice, hundreds of metres thick and sometimes covering many thousands of square kilometres, fastened to the main ice mass but also floating on the sea. It’s from these ice shelves that icebergs are formed.
By slowing the rate at which ice flows into the sea, ice shelves help to keep Antarctic ice in place. Past events have shown that when ice shelves break up the ice banked up behind flows much faster, so if we know how they’re changing we have a good handle on the status of the whole ice sheet.
UK scientists have developed a specialised downward-looking portable radar device that can be left on the surface of ice shelves to measure the thickness of the ice underneath them down to the last millimetre, along with the rate at which it flows and compresses.
Advanced long-life batteries enable each radar to make several measurements a day over several years, storing the data locally while transmitting a reduced data set via satellite to its research team.
This Antarctic summer the Necklace program gets into full swing with the roll-out of radar stations around the continent’s perimeter. Two of the units will be deployed on Amery Ice Shelf (southwest of Perth) by an Australian Antarctic Division team led by Hobart glaciologist Ben Galton-Fenzi.
The Necklace data will help to identify the points around the Antarctic coast where the greatest ice loss is occurring. That in turn will feed into a growing bank of information about the interaction of Antarctic ice with the Southern Ocean.
Besides causing Antarctic coastal sea levels to rise much faster than the global average of a little over 3 mm a year, the melting ice sheet is producing a layer of freshwater, which being lighter than saltwater floats on the ocean surface.
Recent Dutch, New Zealand and Australian research has identified two key effects of a freshwater surface layer: it freezes at a higher temperature than seawater causing more sea ice to form, and it prevents heat loss from subsurface water, increasing the melt rate underneath ice shelves.
That may help explain the anomaly of a small expansion in Antarctic sea ice at a time when Arctic sea ice is diminishing. It is also a troubling warning that the rate of ice sheet melting around the Antarctic coast today will get worse as the years pass.
• “BEYOND Left and Right: Politics in a Hotter Time” is this year’s Richard Jones Memorial Lecture (Friday from 7.30 at the Stanley Burbury Theatre, University of Tasmania) to be delivered by David Orr, professor of environmental studies and politics at Oberlin College, Ohio (US).