
If most projections are correct, there are some torrid times ahead.
Last week saw release of the last of the 2018 reports from the institutions that take Earth’s temperature. Their unanimous diagnosis: we are running a high fever, with worse to come.
All the world’s big public bodies assessing global data – the World Meteorological Organisation and government agencies in the US, Japan and Europe – have determined that 2015, 2016, 2017 and 2018 are the warmest four years since records began in the 1800s.
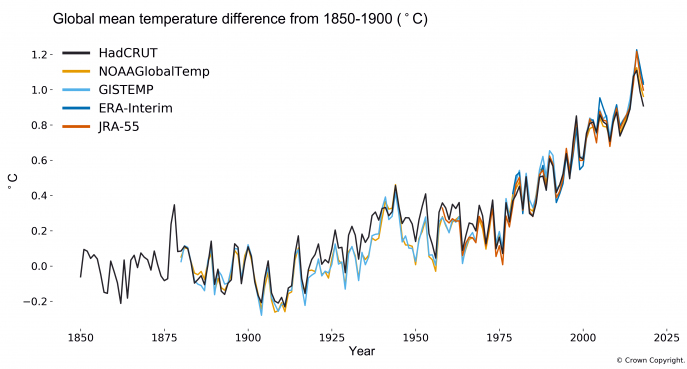
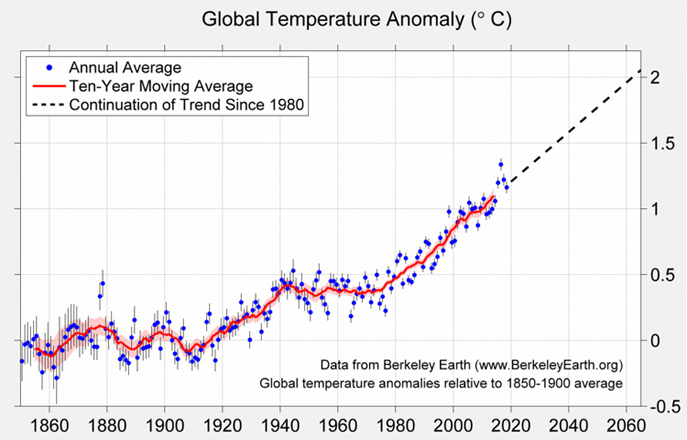
The five main public data repositories are the UK’s Met Office and Climate Research Unit at the University of East Anglia, Copernicus (European Union), NASA and the National Climate Data Center (US), and the Japan Meteorological Agency. Berkeley Earth, a privately-funded research centre in California, offers an independent non-government assessment.
Despite a wide disparity in data sources and methodologies, the findings of all sources correlate closely with each other. All show strong warming since the late 1970s, with notable rises in the late 1990s and in the past seven years.
Last year was generally ranked fourth among the four hottest years, but that was little consolation considering that all of them were well above everything that had gone before.
Berkeley Earth pointed out that in a stable climate just 2.5 per cent of Earth’s surface would typically experience very high temperatures. In 2018 that figure stood at 44 per cent.
The year saw new temperature records set in the north Atlantic, Europe and the eastern Mediterranean, the western Pacific including parts of New Zealand, and inland Antarctica.
The Middle East’s exceptionally warm year doubtless contributed to continuing unrest in that region, and extreme warming in the Arctic led to further significant loss of ice from land and sea.
So will the present strong warming trend continue, and for how long?
Most agencies’ modelling indicates that next year’s mean temperature will be high and that within five years we may briefly be as much as 1.5C above pre-industrial levels, which most scientists would regard as dangerous territory.
Not everyone agrees. James Hansen, former NASA chief climate scientist and still practising his trade, believes that an anticipated El Nino weather event may be weak and short-lived and that a developing solar minimum will be strong and prolonged, keeping temperatures below record levels.
The fact that annual temperature summaries are released in the northern winter must make it hard for some northern citizens, including President Trump, to appreciate the fact of global warming. That shouldn’t be an issue here, especially after this year’s overheated Australian summer.
Australia’s Climate Council, a crowd-funded body of experts set up in 2013 after Tony Abbott’s government abolished the Climate Commission, reports a big rise in extreme weather events here in recent years.
In 2018 Australia experienced exceptional heat across the inland and the south-east, drought from South Australia through the Murray-Darling basin to southern Queensland, severe bushfires in five states and intense rainfall triggering floods in Tasmania, Queensland and Western Australia.
The Council reported that Australia’s average air temperature in 2018 was 1.14C above the 1961-1990 average, making last year the third hottest on record. Nine of our 10 hottest years have occurred since 2000, and heat records have exceeded cold ones 12 times over.
The Climate Council cited business records held by the German reinsurance giant Munich RE showing that whereas in the 1980s there were between 200 and 300 natural catastrophes globally, since 2000 that figure has averaged above 500, and since 2014 above 700.
Similarly, NOAA reports a strong rise in the US in the number of billion-dollar weather disasters (CPI-adjusted) since 2010. The cost in 2018 was more than double the post-1980 annual average, with coastal storms doing most of the damage.
Coastal real estate could bring a massive economic hit. Demand has pushed up its money value both here and in the US, which means a much greater loss when storms arrive. Properties on vulnerable coasts will inevitably become uninsurable, if they’re not already.
As for the longer term, the most reliable guide is the carbon dioxide concentration in the atmosphere. Copernicus relies on satellite observations, which yield a lower CO2 count than surface observatories because they analyse the whole air column, not just CO2-rich surface air.
Even so, Copernicus has atmospheric CO2 in 2018 averaging 406.7 ppm, about 45 per cent higher than pre-industrial levels. More disturbing is the rate of growth, which in 2017 we had cause to think was declining. Instead, in 2018 it rose by 19 per cent.
Decades of warnings about a destabilised climate come down to this: the only action that really matters is cutting fossil fuel emissions rapidly and decisively. Government protests about “meeting targets” are a distraction. In the circumstances that amounts to to gross negligence.